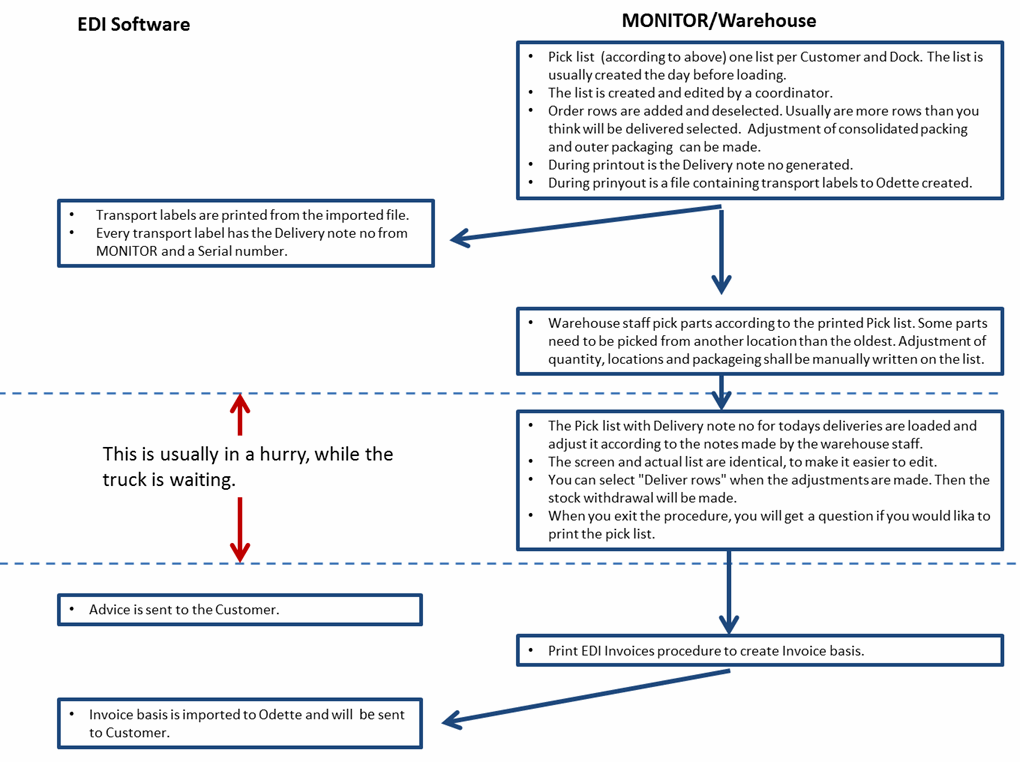
The flow chart below describes how the different activities are connected, even time-wise, when using EDI for deliveries. The left part of the chart shows the activities that take place in the EDI Bridge. The right part of the chart displays the activities that take place in MONITOR.
Flow chart of the delivery process using EDI.