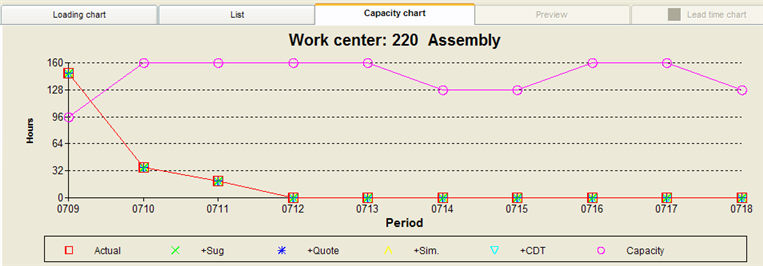
The ![]() Capacity chart tab shows the work center’s capacity and total loading for each respective period, in the form of a line chart.
Capacity chart tab shows the work center’s capacity and total loading for each respective period, in the form of a line chart.
You can only modify the period length on the time axis (day, week, month and year) in this chart. The layout, the chart headings and data series can only be modified for the loading chart. However, if you change the headings in the loading chart, they will also be updated in the capacity chart. All these changes are done via the Info menu which is opened by right-clicking in the chart.
The interesting part about the capacity chart is that it gives you a quick overview of whether the work center’s loading exceeds its capacity. This feature makes it easy to discover "overloading" or capacity shortages in a work center in time, allowing you to replan or change the capacity if needed.