The Lead time chart is a powerful graphic diagram where horizontal bars show the lead times along the time axis (the lapse of time between the start and finish period) for orders, including incorporated M-parts, operations and material (see the Gantt chart). The thing that makes the lead time chart so powerful, is that you can also use it to replan orders, parts or operations.
The lead time chart is very useful to view the connection between parts and operations in an order in a graph.
Besides the Order List procedure, you can also open the lead time chart in different ways in the Order Info, Adding / Replanning, Orders / Work Center, Loading / Work Center and Loading Selection procedures in the Manufacturing module, as well as in the Priority Planning in the Workshop Info module.
The list type that you select in the Order List, and also from which of the other procedures the lead time chart is open, determines how much information will be shown in the lead time chart.
Settings
At the top of the window you can change settings like, selecting a Scale type by Day, Week or Month, as well as a Scale width. You can determine if you want to replan underlying parts and show New finish (period).

The settings in the lead time chart.
The Information in the Left Portion of the Window
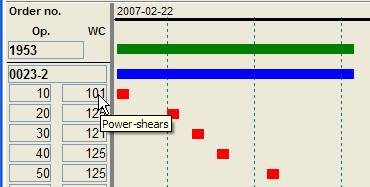
In the left portion of the window you will see the information that each bar represents, such as order number, part number, operation number and work center number. By hovering your mouse over a part number, operation number or work center number, the corresponding name will be shown in a yellow help box to the right of your mouse pointer.

Order, part and operation information.
The Information in the Bars of the Lead Time Chart
The main portion of the window shows the actual lead time chart with the above mentioned bars. The green bar = orders; the blue bar = M-parts; the red bar = operations and the purple bar = subcontracting operation. Any reporting that has been made is symbolized by a black line in the chart, whose length corresponds to the reported quantity of the current operation or part. This does not apply to order bars. If final reporting has been made, a black line appears along the entire bar.

The reporting performed for an operation.
If you hold your mouse pointer over a green bar (orders), you will see the start and finish period at the bottom, in the status row.
You can perform replanning here, either by just dragging or moving the bars over to new periods using your mouse; or by right-clicking a bar to open the Info menu, selecting the Show Info alternative and manually entering a period.
Time Axis
At the bottom of the window, you will see a time axis that can be changed to display day, week or month. If you hover your mouse over a period, you can see the current date in the status row at the very bottom of your window.

The time axis.
On current date, a vertical dotted line will appear with current date above it. That means that there should really not be anything “unfinished” to the left of this line, as this would signify "lag". This will also be reported as lag in the loading plan.

Current date.
The Powerful Lead Time Chart
What makes the lead time chart so powerful, is on one hand that you can use it to replan existing orders, parts or operations. If you are going to replan a part, the top portion of the window will allow you to decide if you want to replan underlying levels as well. Read more about this method of replanning under Replanning Using the Lead Time Chart. And on the other hand, you can also use it to obtain additional information about an order, a part or an operation, by just right-clicking a bar to open the Info menu and selecting the Show info option.